Abstract
1. Introduction
2. Materials and Methods
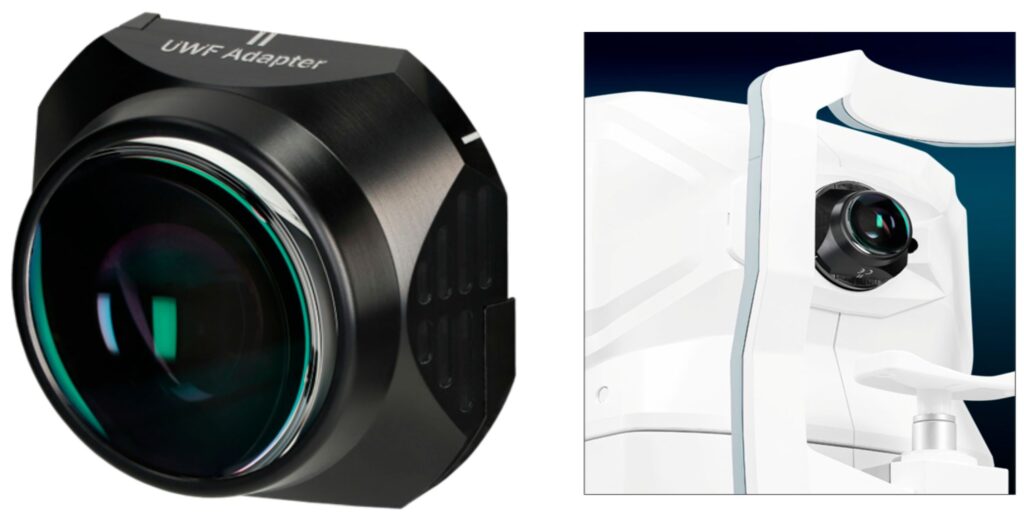
Figure 1. The add-on UWF adapter (left) and the adapter mounted on the device (right).
3. Results
3.1. OCT Measurements
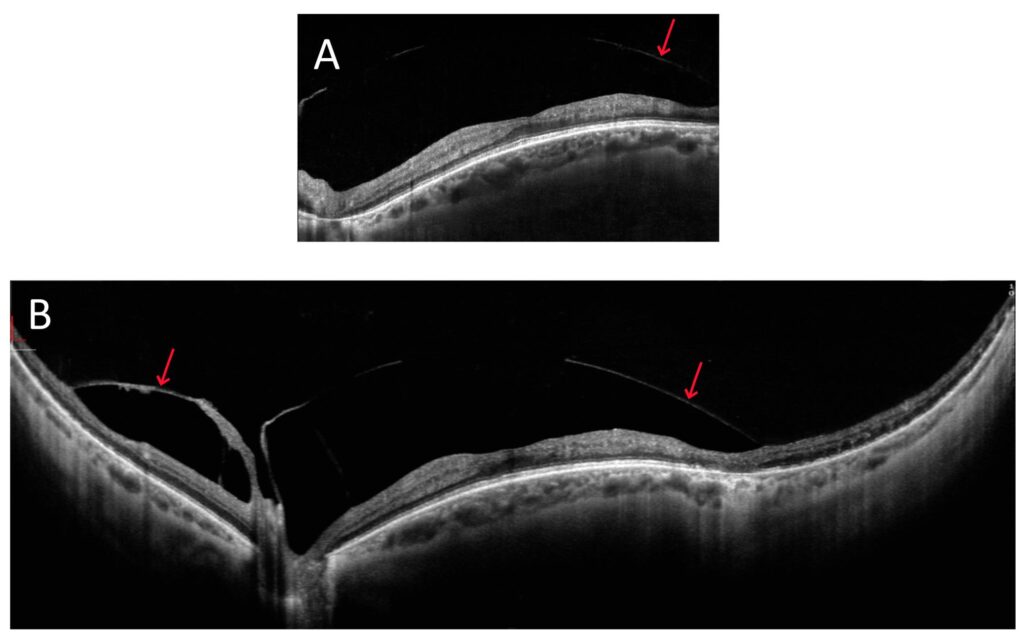
Figure 2. OCT image of a patient with a dome-shaped macula (female, age 46): (A) 10 mm wide scan; (B) 22 mm wide scan. The arrows point at the vitreoretinal traction.
Another figure (Figure 3) demonstrates posterior staphyloma due to high myopia, which extends both vertically and horizontally over a significant area. With a full-range UWF scan that is 22 mm wide and 6 mm high, we can trace the significant depression in the central part of the retina (asterisk) and the strongly curved shape of the posterior pole.
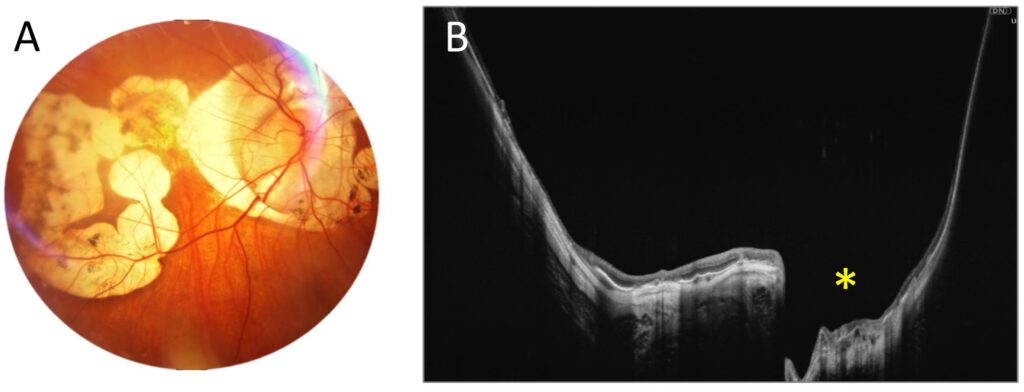
Figure 3. Posterior staphyloma due to high myopia (male, age 43). (A). Colour fundus photograph showing extensive atrophy. (B). A 22 mm wide UWF full-range OCT scan of the posterior pole. The asterisk indicates a localized outpouching around the optic disc.
Figure 4 depicts a patient with a choroidal tumour. The UWF scan reveals a solid choroidal structure (asterisk) with no large vessels, along with overlying drusen temporal to the macula, while the centre of the scan shows a normal retina and choroid.
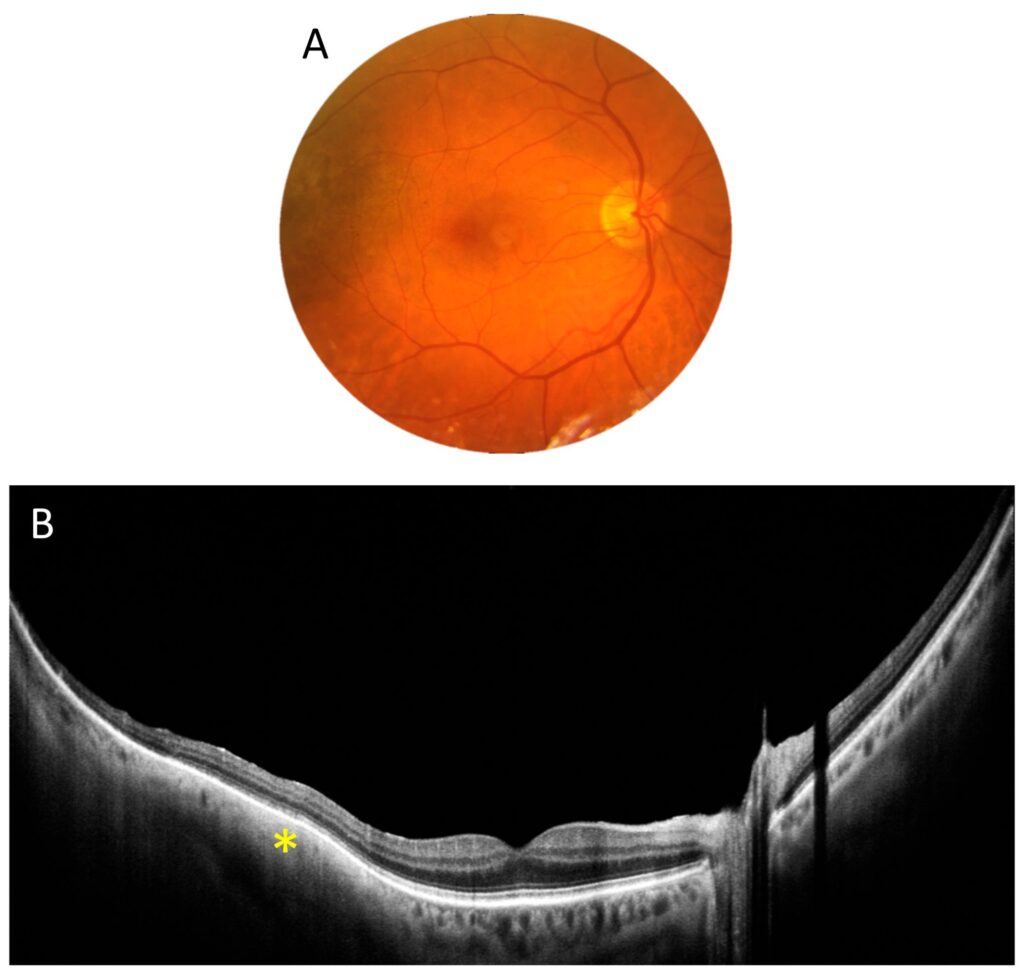
Figure 4. Choroidal tumour (female, age 55). (A). Colour fundus photograph revealing a darker area temporal to the macula. (B). A 22 mm wide UWF OCT scan of the posterior pole. The asterisk shows a solid choroidal structure.
The next two figures illustrate the use of UWF OCT scanning for en-face analysis. In Figure 5, the central area of atrophy (asterisk) can be seen to be surrounded by only a few small drusen. OCT fundus reconstruction at the choroidal level clearly visualises the boundaries of the area of increased light penetration into the choroid at the site of retinal pigment epithelial atrophy. The outer retina thickness map made from OCT data reveals a reduction in the thickness of the retinal layers in the centre. Figure 6 shows the fundus of a patient with epiretinal membrane (asterisks). In this case, by reconstructing the inner retinal thickness map, the extent of the membrane can be visualised in detail. In addition, the post-operative retinal damage is visible as an area of inner retinal atrophy (arrow).
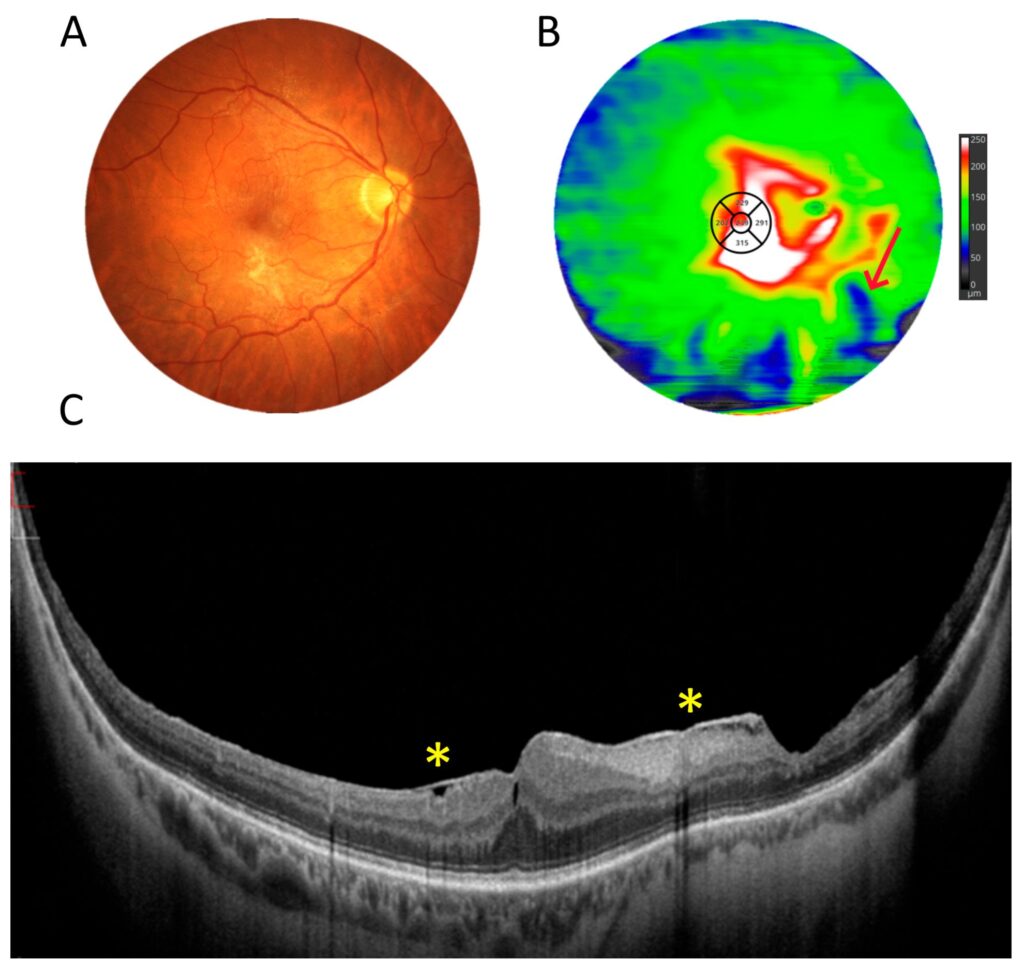
Figure 6. Patient with epiretinal membrane (male, age 62). (A) Colour fundus photograph. (B) UWF OCT thickness map of the inner retina. The red arrow indicates the site of iatrogenic damage to the retina. (C) A 22 mm wide UWF OCT scan. The asterisks indicate epiretinal membrane.
The last two figures in this section demonstrate surgical cases. Figure 7 shows an example of the preoperative assessment of a strongly adherent vitreous traction (arrow) to the optic disc due to proliferative diabetic retinopathy (DR). A three-dimensional reconstruction of the vitreoretinal interface from a 22 mm wide OCT scan visualises the reciprocal relationship of the two structures on a single image. Figure 8, on the other hand, shows the eye after vitrectomy for retinal detachment. A typical 6 mm OCT scan reveals a shallow pocket of fluid (arrows) under the sensory retina in the macula. Unfortunately, such a scan does not show how far into the periphery the fluid extends. It is only with a 22 mm UWF scan that all the fluid can be visualised.
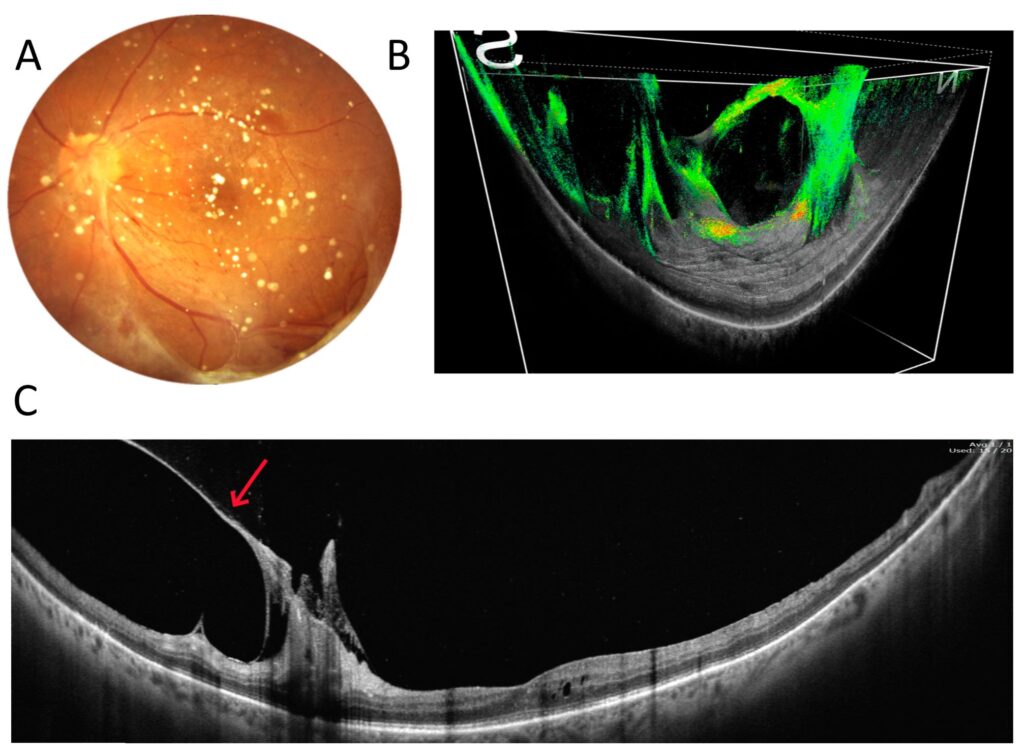
Figure 7. Vitreoretinal traction in proliferative diabetic retinopathy (female, age 53). (A) Colour fundus photograph. (B) Three-dimensional UWF OCT reconstruction of the interface between the retina and vitreous body. (C) A 22 mm wide UWF OCT scan of the retina across the posterior pole. The arrow points at a strongly adherent vitreous traction.
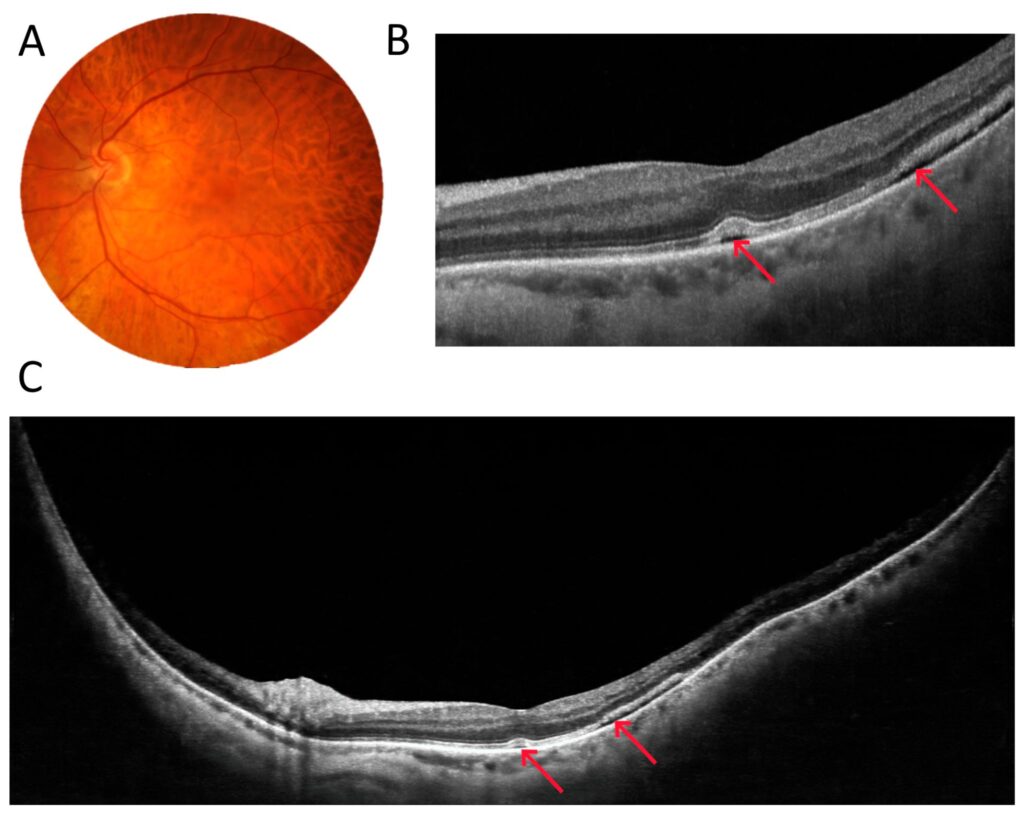
Figure 8. Patient after vitrectomy for retinal detachment (male, age 37). (A) Colour fundus photograph. (B) A 6 mm wide macular scan showing a flat pocket of fluid in its temporal part. (C) A 22 mm wide UWF OCT scan revealing the entire area of sensory retinal detachment. The arrows point at subretinal fluid.
3.2. Angio-OCT Measurements
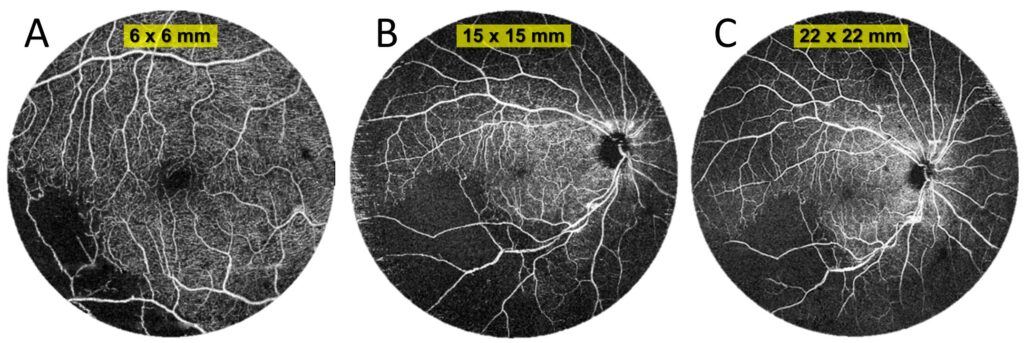
Figure 9. OCT angiography of a patient with branch retinal vein occlusion (female, age 46). (A) Measurement with a scan area of 6 × 6 mm. (B) Angiography taken over an area of 15 × 15 mm. (C) UWF OCT angiography covering an area 22 mm in diameter.
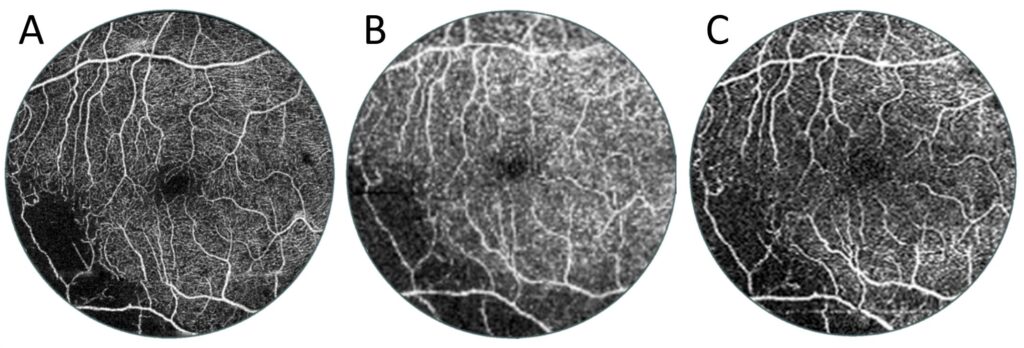
Figure 10. Comparison of the same size central 6 × 6 mm area of different-sized OCT angiographies of the patient in Figure 9. (A) Reference OCT angiography of 6 mm diameter. (B) The central area of the OCT examination with a width of 15 mm. This angio-OCT examination has a lower scanning density and hence lower quality than the other two images. (C) Enlarged UWF OCT centre of angiography taken with a diameter of 22 mm.
Figure 11 shows a case of a patient with central retinal vein occlusion. The prominent haemorrhages obscure the view of the central macula on the colour fundus photo and cast small optical shadows in OCT angiography. The visualisation of the central circulation in a 22 × 22 mm UWF OCT scan is similar to that of a 6 × 6 mm measurement. By using a wide scan, however, extensive zones of non-perfusion (asterisks) throughout the mid-periphery can be easily seen at the same time.
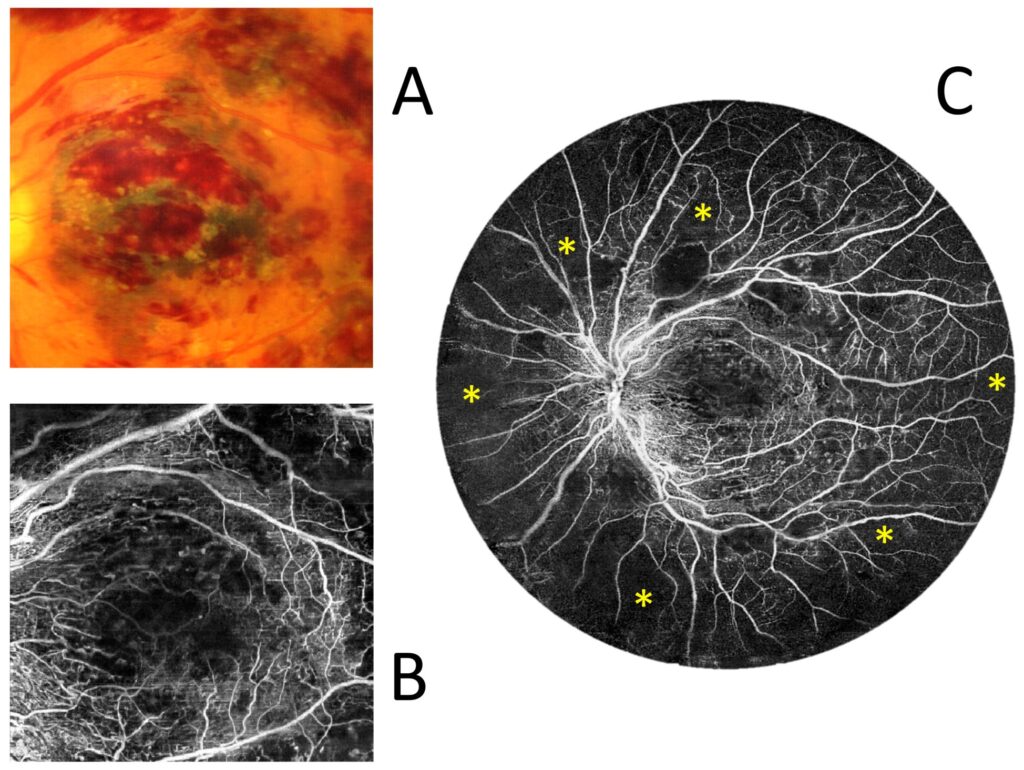
Figure 11. Central retinal vein occlusion (female, age 69). (A) Colour fundus photograph of the central 6 × 6 mm area. (B) OCT angiography measurement of the size of a colour fundus photograph. (C) UWF OCT angiography covering an area that is 22 mm in diameter. The asterisks indicate non-perfusion zones.
The next two cases present patients with proliferative DR. Figure 12 shows a 6 × 6 mm scan of the macula. It presents an enlargement of the foveal avascular zone and small areas of non-perfusion around it. It does not provide any other retinal or flow information. In contrast, the 22 mm UWF scan shows extensive zones of non-perfusion (asterisks) in the periphery and vascular proliferation (arrows), in addition to the above-mentioned changes in the centre. Thus, it indicates an urgent need for extended treatment. Figure 13 relates the 22 mm UWF angio-OCT scan to the wide-angle fluorescein angiography (FA) mosaic. Both examinations reveal vascular proliferation (red arrow), capillary dropout (blue arrow), and non-perfusion zones (asterisk). However, angio-OCT shows vascular structures more clearly due to the lack of background fluorescence, as well as the staining of other lesions.
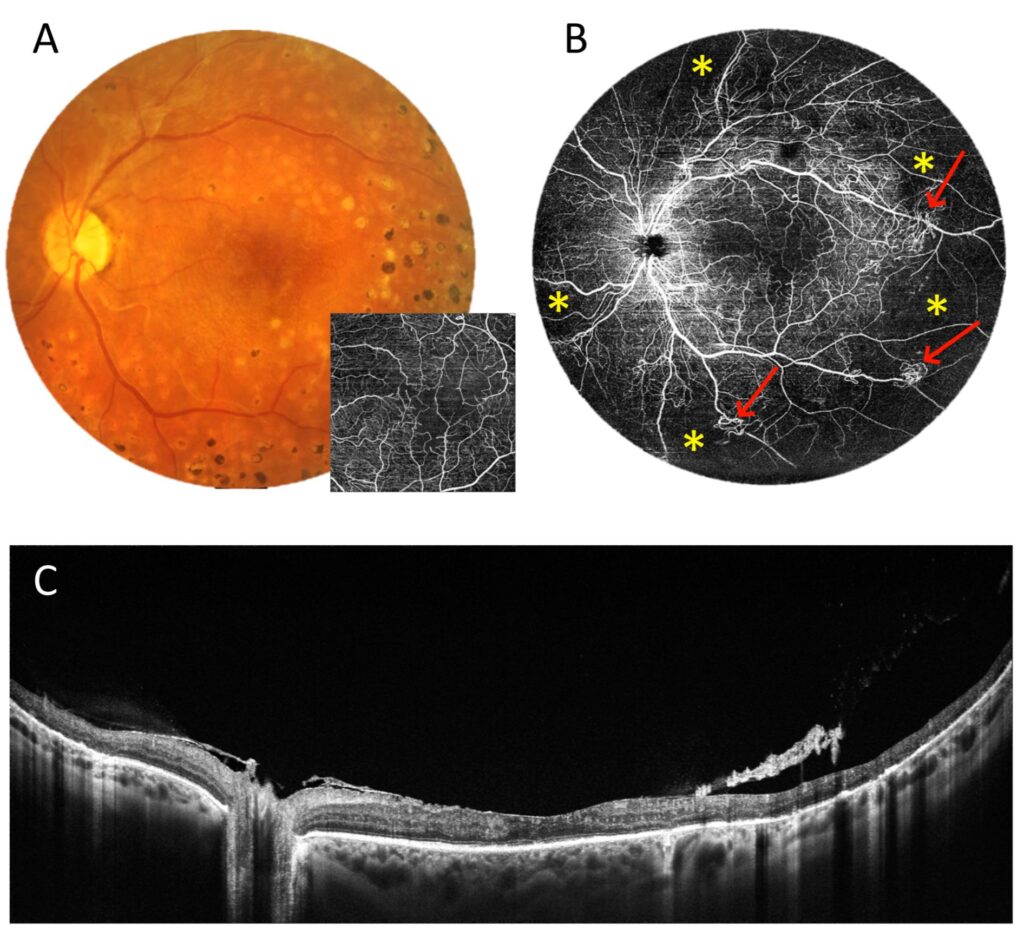
Figure 12. Proliferative diabetic retinopathy (female, age 54). (A). Colour fundus photograph and 6 × 6 mm OCT angiography. (B). UWF OCT angiography from a 22 mm wide area. The asterisks indicate non-perfusion zones and the arrows point to vascular proliferation. (C). UWF OCT scan of the posterior pole.
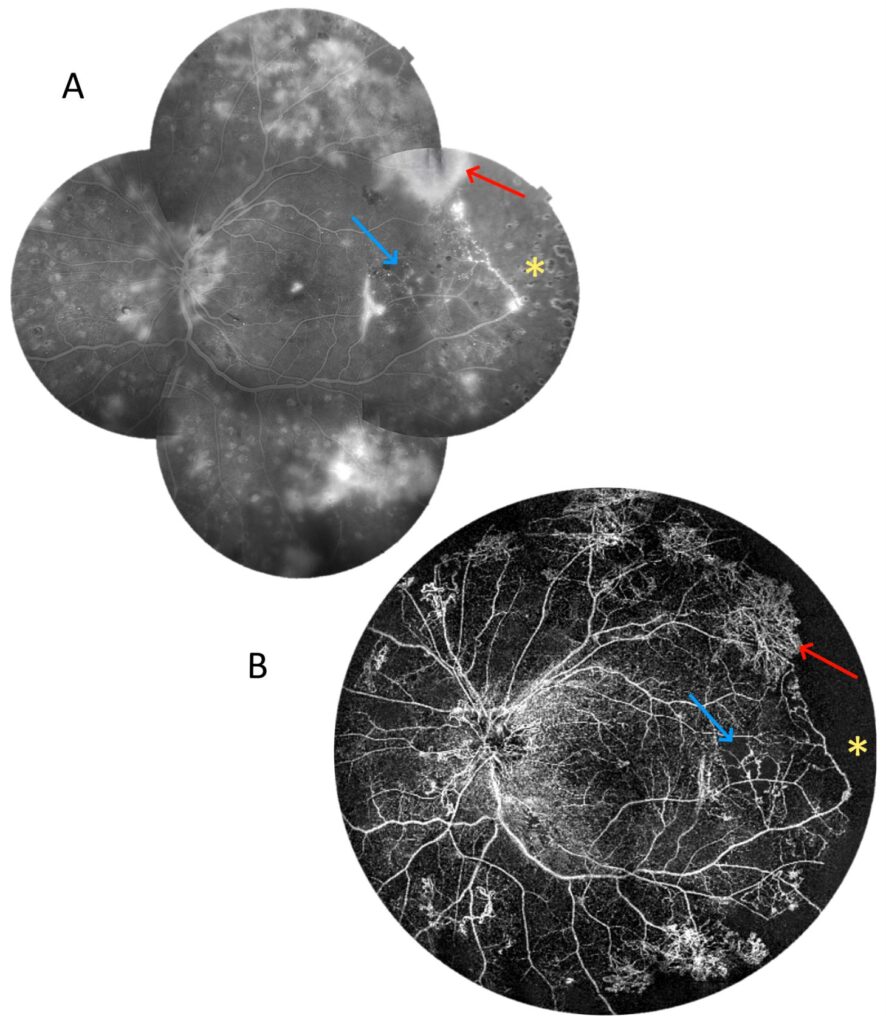
Figure 13. Proliferative diabetic retinopathy (male, age 37). (A) A wide-angle fluorescein angiography mosaic. (B) UWF OCT angiography covering a 22 mm wide area. The red arrows point at the vascular proliferation, whereas the blue arrows indicate capillary dropout. The asterisks show non-perfusion zones.
3.3. OCT and Angio-OCT Measurements
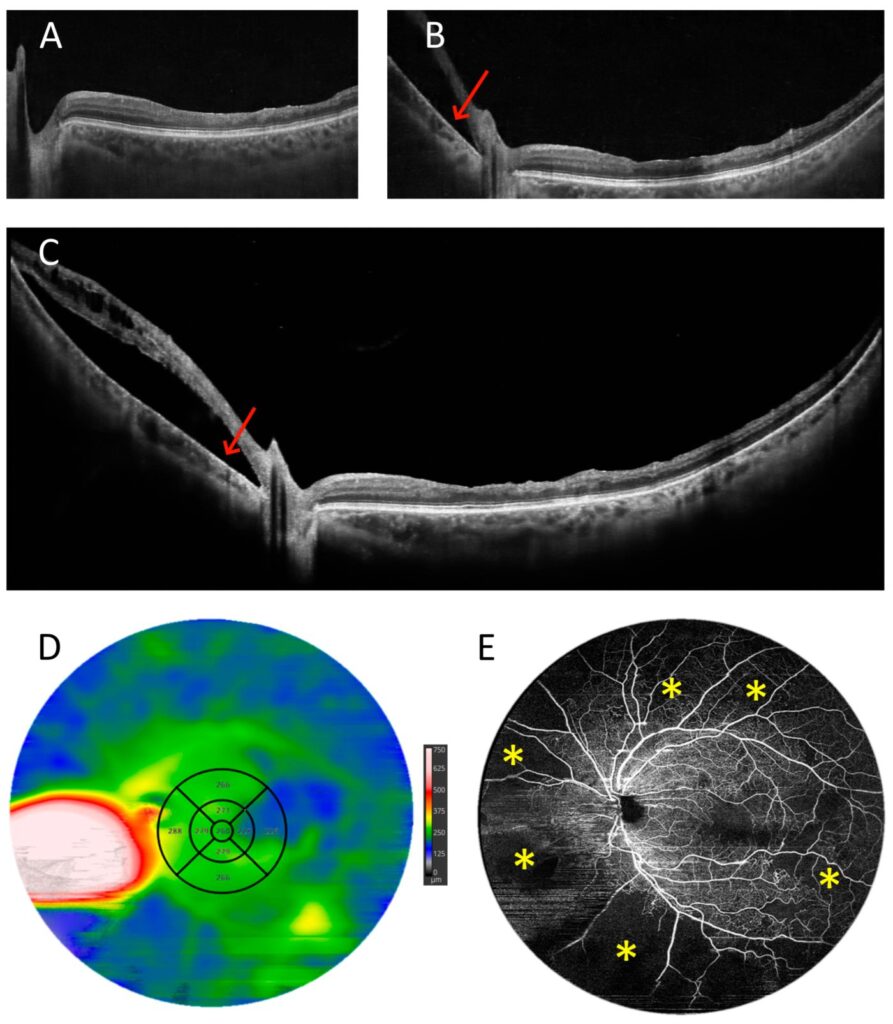
Figure 14. Patient after vitrectomy for retinal detachment (male, age 54). (A–C) OCT scans with widths of 10, 15, and 22 mm, respectively. (D) UWF OCT retinal thickness map. The arrow points at the retinal detachment. (E) UWF OCT angiography of the 22 mm area. The asterisks indicate extensive zones of non-perfusion.
3.4. UWF Angio-OCT Mosaics
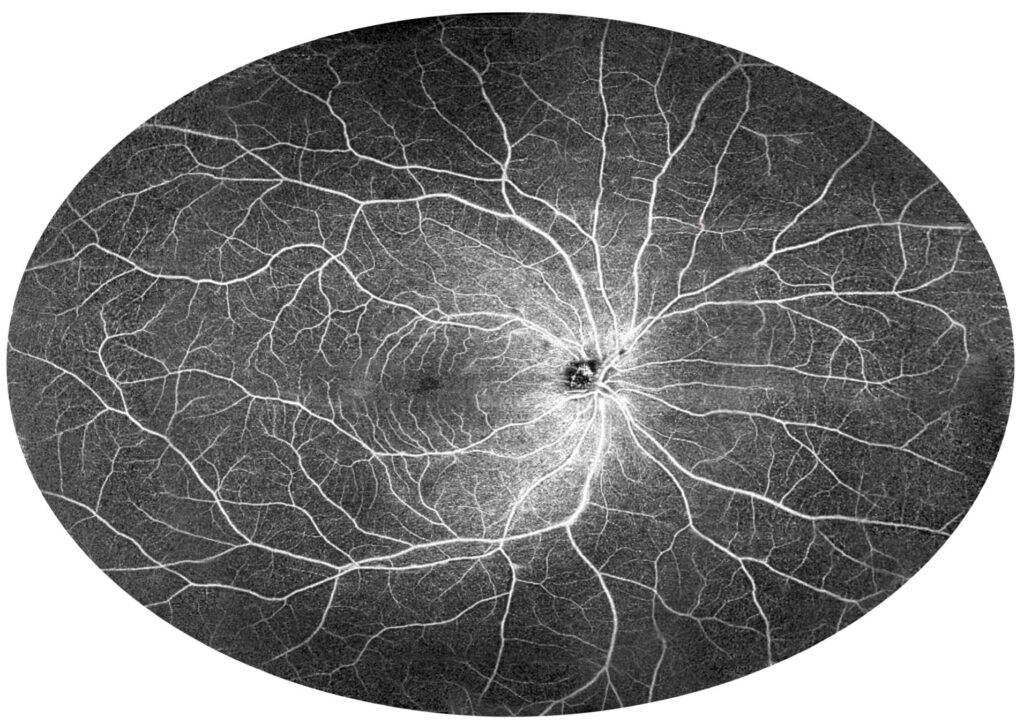
Figure 15. Healthy individual (female, age 26). The figure shows a 140-degree mosaic of 22 mm wide UWF OCT angiography measurements, showing increased imaging field of view (140-degree external field of view is equal to 210-degree internal field of view—nomenclature as in UWF Optos devices).
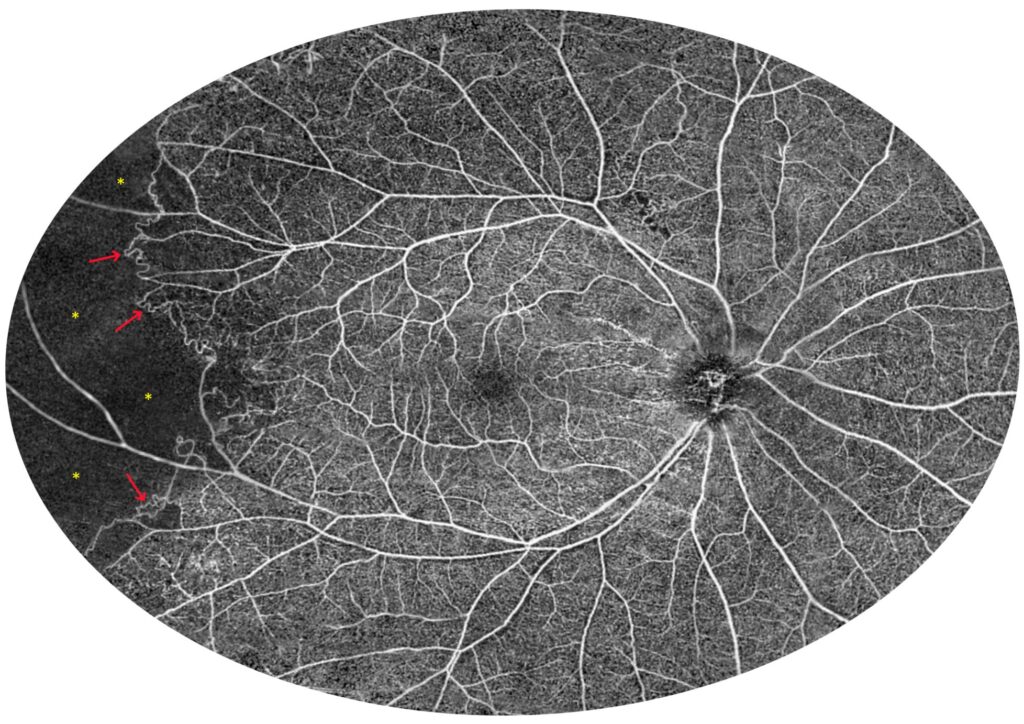
Figure 16. Eales disease (male, age 27). The figure shows a 100-degree OCT angiography montage of 22 mm UWF scans, showing extensive peripheral ischaemia and collateral formation (100-degree external field of view is equal to 150-degree internal field of view—nomenclature as in UWF Optos devices). The asterisks indicate non-perfusion zones and the arrows point at collateral vessels.
3.5. Retinal Thickness Measurements
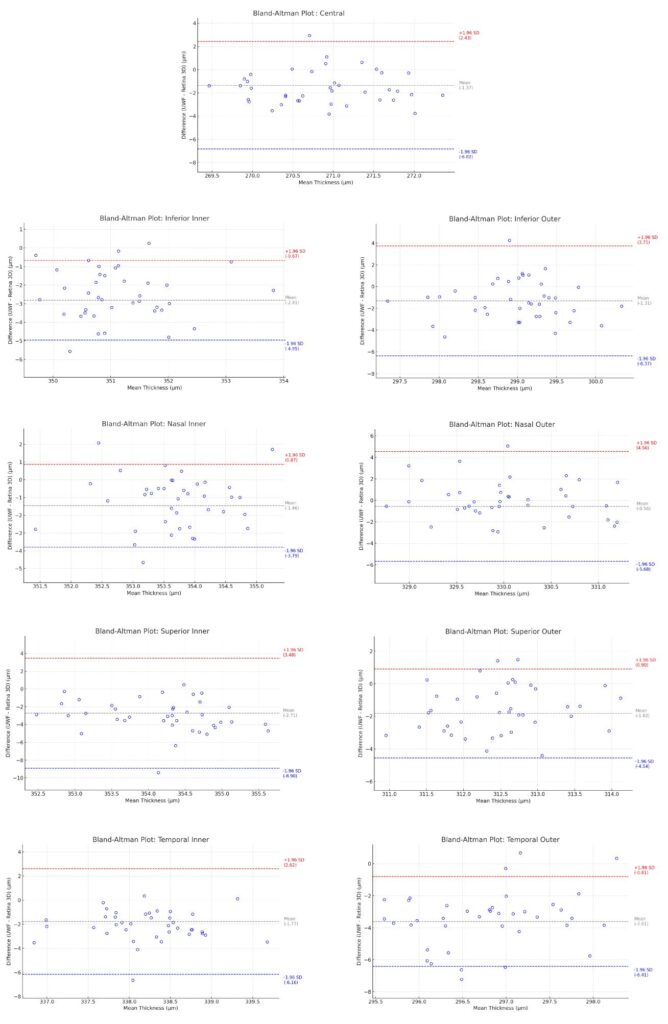
Figure 17. Bland–Altman plots for a thickness profile comparison between UWF and a standard retina scan (Retina 3D) in ETDRS sectors.
4. Discussion
Funding
Institutional Review Board Statement
Informed Consent Statement
Data Availability Statement
Conflicts of Interest
References
- Tzaridis, S.; Friedlander, M. Optical coherence tomography: When a picture is worth a million words. J. Clin. Investig. 2023, 133, e174951. [Google Scholar] [CrossRef] [PubMed]
- Huang, D.; Swanson, E.A.; Lin, C.P.; Schuman, J.S.; Stinson, W.G.; Chang, W.; Hee, M.R.; Flotte, T.; Gregory, K.; Puliafito, C.A.; et al. Optical coherence tomography. Science 1991, 254, 1178–1181. [Google Scholar] [CrossRef]
- Wojtkowski, M.; Srinivasan, V.; Fujimoto, J.G.; Ko, T.; Schuman, J.S.; Kowalczyk, A.; Duker, J.S. Three-dimensional retinal imaging with high-speed ultrahigh-resolution optical coherence tomography. Ophthalmology 2005, 112, 1734–1746. [Google Scholar] [CrossRef]
- Sikorski, B.L.; Malukiewicz, G.; Stafiej, J.; Lesiewska-Junk, H.; Raczynska, D. The diagnostic function of OCT in diabetic maculopathy. Mediat. Inflamm. 2013, 2013, 434560. [Google Scholar] [CrossRef]
- Sikorski, B.L.; Gorczynska, I.; Bukowska, D.; Gorczynska, I.; Szkulmowski, M.; Krawiec, K.; Malukiewicz, G.; Wojtkowski, M. Noninvasive Visualization of 3-D Retinal Microcapillary Network Using OCT. PO 263. In Proceedings of the American Academy of Ophthalmology Meeting, Chicago, IL, USA, 10–13 November 2012. [Google Scholar]
- Ruminski, D.; Sikorski, B.L.; Bukowska, D.; Szkulmowski, M.; Krawiec, K.; Malukiewicz, G.; Bieganowski, L.; Wojtkowski, M. OCT angiography by absolute intensity difference applied to normal and diseased human retinas. Biomed. Opt. Express 2015, 6, 2738–2754. [Google Scholar] [CrossRef] [PubMed]
- Spaide, R.F.; Fujimoto, J.G.; Waheed, N.K.; Sadda, S.R.; Staurenghi, G. Optical coherence tomography angiography. Prog. Retin. Eye Res. 2018, 64, 1–55. [Google Scholar] [CrossRef] [PubMed]
- Gao, S.S.; Jia, Y.; Zhang, M.; Su, J.P.; Liu, G.; Hwang, T.S.; Bailey, S.T.; Huang, D. Optical Coherence Tomography Angiography. Investig. Ophthalmol. Vis. Sci. 2016, 57, OCT27-36. [Google Scholar] [CrossRef]
- Cui, Y.; Zhu, Y.; Wang, J.C.; Lu, Y.; Zeng, R.; Katz, R.; Vingopoulos, F.; Le, R.; Laíns, I.; Wu, D.M.; et al. Comparison of widefield swept-source optical coherence tomography angiography with ultra-widefield colour fundus photography and fluorescein angiography for detection of lesions in diabetic retinopathy. Br. J. Ophthalmol. 2021, 105, 577–581. [Google Scholar] [CrossRef]
- Tan, T.E.; Ibrahim, F.; Chandrasekaran, P.R.; Teo, K.Y.C. Clinical utility of ultra-widefield fluorescein angiography and optical coherence tomography angiography for retinal vein occlusions. Front. Med. 2023, 10, 1110166. [Google Scholar] [CrossRef]
- Amato, A.; Nadin, F.; Borghesan, F.; Cicinelli, M.V.; Chatziralli, I.; Sadiq, S.; Mirza, R.; Bandello, F.; Sugawara, A. Widefield Optical Coherence Tomography Angiography in Diabetic Retinopathy. J. Diabetes Res. 2020, 2020, 8855709. [Google Scholar] [CrossRef]
- Bajka, A.; Bacci, T.; Wiest, M.R.J.; Brinkmann, M.; Hamann, T.; Toro, M.; Zweifel, S.A. Feasibility and Clinical Utility of Wide-Field Optical Coherence Tomography Angiography Compared to Ultrawide-Field Fluorescein Angiography in Patients with Diabetic Retinopathy. Klin. Monbl Augenheilkd. 2023, 240, 490–495. [Google Scholar] [CrossRef] [PubMed]
- Yoshida, M.; Murakami, T.; Kawai, K.; Nishikawa, K.; Ishihara, K.; Mori, Y.; Tsujikawa, A. Inference of Capillary Nonperfusion Progression on Widefield OCT Angiography in Diabetic Retinopathy. Investig. Ophthalmol. Vis. Sci. 2023, 64, 24. [Google Scholar] [CrossRef] [PubMed]
- Yao, X.; Toslak, D.; Son, T.; Ma, J. Understanding the relationship between visual-angle and eye-angle for reliable determination of the field-of-view in ultra-wide field fundus photography. Biomed Opt Express. 2021, 30, 6651–6659. [Google Scholar] [CrossRef]
- Aiello, L.P.; Odia, I.; Glassman, A.R.; Melia, M.; Jampol, L.M.; Bressler, N.M.; Kiss, S.; Silva, P.S.; Wykoff, C.C.; Diabetic Retinopathy Clinical Research Network; et al. Comparison of Early Treatment Diabetic Retinopathy Study Standard 7-Field Imaging with Ultrawide-Field Imaging for Determining Severity of Diabetic Retinopathy. JAMA Ophthalmol. 2019, 137, 65–73. [Google Scholar] [CrossRef] [PubMed]
- Silva, P.S.; Marcus, D.M.; Liu, D.; Aiello, L.P.; Antoszyk, A.; Elman, M.; Friedman, S.; Glassman, A.R.; Googe, J.M.; Jampol, L.M.; et al. Association of Ultra-Widefield Fluorescein Angiography-Identified Retinal Nonperfusion and the Risk of Diabetic Retinopathy Worsening Over Time. JAMA Ophthalmol. 2022, 140, 936–945. [Google Scholar] [CrossRef]
- Marcus, D.M.; Silva, P.S.; Liu, D.; Aiello, L.P.; Antoszyk, A.; Elman, M.; Friedman, S.; Glassman, A.R.; Googe, J.M.; DRCR Retina Network; et al. Association of Predominantly Peripheral Lesions on Ultra-Widefield Imaging and the Risk of Diabetic Retinopathy Worsening Over Time. JAMA Ophthalmol. 2022, 140, 946–954. [Google Scholar] [CrossRef]
- Nicholson, L.; Vazquez-Alfageme, C.; Patrao, N.V.; Triantafyllopolou, I.; Bainbridge, J.W.; Hykin, P.G.; Sivaprasad, S. Retinal Nonperfusion in the Posterior Pole Is Associated with Increased Risk of Neovascularization in Central Retinal Vein Occlusion. Am. J. Ophthalmol. 2017, 182, 118–125. [Google Scholar] [CrossRef] [PubMed]
- Silva, P.S.; Cavallerano, J.D.; Haddad, N.M.N.; Kwak, H.; Dyer, K.H.; Omar, A.F.; Shikari, H.; Sun, J.K.; Aiello, L.P. Peripheral Lesions Identified on Ultrawide Field Imaging Predict Increased Risk of Diabetic Retinopathy Progression over 4 Years. Ophthalmology 2015, 122, 949–956. [Google Scholar] [CrossRef]
- Zhang, W.; Li, C.; Gong, Y.; Liu, N.; Cao, Y.; Li, Z.; Zhang, Y. Advanced ultrawide-field optical coherence tomography angiography identifies previously undetectable changes in biomechanics-related parameters in nonpathological myopic fundus. Front. Bioeng. Biotechnol. 2022, 10, 920197. [Google Scholar] [CrossRef]
- Russell, J.F.; Flynn, H.W., Jr.; Sridhar, J.; Townsend, J.H.; Shi, Y.; Fan, K.C.; Scott, N.L.; Hinkle, J.W.; Lyu, C.; Gregori, G.; et al. Distribution of Diabetic Neovascularization on Ultra-Widefield Fluorescein Angiography and on Simulated Widefield OCT Angiography. Am. J. Ophthalmol. 2019, 207, 110–120. [Google Scholar] [CrossRef]
- Hwang, T.S.; Gao, S.S.; Liu, L.; Lauer, A.K.; Bailey, S.T.; Flaxel, C.J.; Wilson, D.J.; Huang, D.; Jia, Y. Automated Quantification of Capillary Nonperfusion Using Optical Coherence Tomography Angiography in Diabetic Retinopathy. JAMA Ophthalmol. 2016, 134, 367–373. [Google Scholar] [CrossRef] [PubMed]
- Gao, M.; Hormel, T.T.; Guo, Y.; Tsuboi, K.; Flaxel, C.J.; Huang, D.; Hwang, T.S.; Jia, Y. Perfused and Nonperfused Microaneurysms Identified and Characterized by Structural and Angiographic OCT. Ophthalmol. Retin. 2023, 8, 108–115. [Google Scholar] [CrossRef]
- Yeung, L.; Lee, Y.-C.; Lin, Y.-T.; Lee, T.-W.; Lai, C.-C. Macular Ischemia Quantification Using Deep-Learning Denoised Optical Coherence Tomography Angiography in Branch Retinal Vein Occlusion. Transl. Vis. Sci. Technol. 2021, 10, 23. [Google Scholar] [CrossRef] [PubMed]
- Durbin, M.K.; An, L.; Shemonski, N.D.; Soares, M.; Santos, T.; Lopes, M.; Neves, C.; Cunha-Vaz, J. Quantification of Retinal Microvascular Density in Optical Coherence Tomographic Angiography Images in Diabetic Retinopathy. JAMA Ophthalmol. 2017, 135, 370–376. [Google Scholar] [CrossRef]
- Khodabandeh, A.; Shahraki, K.; Roohipoor, R.; Riazi-Esfahani, H.; Yaseri, M.; Faghihi, H.; Bazvand, F. Quantitative measurement of vascular density and flow using optical coherence tomography angiography (OCTA) in patients with central retinal vein occlusion: Can OCTA help in distinguishing ischemic from non-ischemic type? Int. J. Retin. Vitr. 2018, 4, 47. [Google Scholar] [CrossRef] [PubMed]
- Kaizu, Y.; Nakao, S.; Sekiryu, H.; Wada, I.; Yamaguchi, M.; Hisatomi, T.; Ikeda, Y.; Kishimoto, J.; Sonoda, K.-H. Retinal flow density by optical coherence tomography angiography is useful for detection of nonperfused areas in diabetic retinopathy. Graefes Arch. Clin. Exp. Ophthalmol. 2018, 256, 2275–2282. [Google Scholar] [CrossRef]
- Lahme, L.; Marchiori, E.; Panuccio, G.; Nelis, P.; Schubert, F.; Mihailovic, N.; Torsello, G.; Eter, N.; Alnawaiseh, M. Changes in retinal flow density measured by optical coherence tomography angiography in patients with carotid artery stenosis after carotid endarterectomy. Sci. Rep. 2018, 8, 17161. [Google Scholar] [CrossRef]
- Lujan, B.J.; Calhoun, C.T.; Glassman, A.R.; Googe, J.M.; Jampol, L.M.; Melia, M.; Schlossman, D.K.; Sun, J.K.; DRCR Retina Network. Optical Coherence Tomography Angiography Quality Across Three Multicenter Clinical Studies of Diabetic Retinopathy. Transl. Vis. Sci. Technol. 2021, 10, 2. [Google Scholar] [CrossRef]
- Gao, S.S.; Jia, Y.; Liu, L.; Zhang, M.; Takusagawa, H.L.; Morrison, J.C.; Huang, D. Compensation for Reflectance Variation in Vessel Density Quantification by Optical Coherence Tomography Angiography. Investig. Ophthalmol. Vis. Sci. 2016, 57, 4485–4492. [Google Scholar] [CrossRef]
- Grading diabetic retinopathy from stereoscopic color fundus photographs—An extension of the modified Airlie House classification. ETDRS report number 10. Early Treatment Diabetic Retinopathy Study Research Group. Ophthalmology 1991, 98, 786–806. [CrossRef]
- Samara, W.A.; Shahlaee, A.; Adam, M.K.; Khan, M.A.; Chiang, A.; Maguire, J.I.; Hsu, J.; Ho, A.C. Quantification of Diabetic Macular Ischemia Using Optical Coherence Tomography Angiography and Its Relationship with Visual Acuity. Ophthalmology 2017, 124, 235–244. [Google Scholar] [CrossRef] [PubMed]
- Hwang, T.S.; Hagag, A.M.; Wang, J.; Zhang, M.; Smith, A.; Wilson, D.J.; Huang, D.; Jia, Y. Automated Quantification of Nonperfusion Areas in 3 Vascular Plexuses with Optical Coherence Tomography Angiography in Eyes of Patients with Diabetes. JAMA Ophthalmol. 2018, 136, 929–936. [Google Scholar] [CrossRef] [PubMed]
- Atik, A.; Barton, K.; Azuara-Blanco, A.; Kerr, N.M. Health economic evaluation in ophthalmology. Br. J. Ophthalmol. 2021, 105, 602–607. [Google Scholar] [CrossRef] [PubMed]
- Framme, C.; Dittberner, M.; Rohwer-Mensching, K.; Gottschling, J.; Buley, P.; Hufendiek, K.; Hufendiek, K.; Junker, B.; Tode, J.; Lammert, F.; et al. Performance and cost calculation for a university ophthalmological outpatient clinic. Ophthalmologe 2022, 119, 46–54. [Google Scholar] [CrossRef]
- Murphy, A.; McElnea, E.; Byrne, S. Health technology assessment: A primer for ophthalmology. Eur. J. Ophthalmol. 2018, 28, 358–364. [Google Scholar] [CrossRef]
- Konno, A.; Ishibazawa, A.; De Pretto, L.; Shimouchi, A.; Omae, T.; Song, Y.-S. Relationship between nonperfusion area from widefield optical coherence tomography angiography and macular vascular parameters in diabetic retinopathy. Int. Ophthalmol. 2023, 43, 4803–4814. [Google Scholar] [CrossRef]
Disclaimer/Publisher’s Note: The statements, opinions and data contained in all publications are solely those of the individual author(s) and contributor(s) and not of MDPI and/or the editor(s). MDPI and/or the editor(s) disclaim responsibility for any injury to people or property resulting from any ideas, methods, instructions or products referred to in the content. |